The award-winning WIRED UK Podcast with James Temperton and the rest of the team. Listen every week for the an informed and entertaining rundown of latest technology, science, business and culture news. New episodes every Friday.
…
continue reading
Manage episode 519990485 series 3364760
Content provided by LessWrong. All podcast content including episodes, graphics, and podcast descriptions are uploaded and provided directly by LessWrong or their podcast platform partner. If you believe someone is using your copyrighted work without your permission, you can follow the process outlined here https://staging.podcastplayer.com/legal.
When a new dollar goes into the capital markets, after being bundled and securitized and lent several times over, where does it end up? When society's total savings increase, what capital assets do those savings end up invested in?
When economists talk about “capital assets”, they mean things like roads, buildings and machines. When I read through a company's annual reports, lots of their assets are instead things like stocks and bonds, short-term debt, and other “financial” assets - i.e. claims on other people's stuff. In theory, for every financial asset, there's a financial liability somewhere. For every bond asset, there's some payer for whom that bond is a liability. Across the economy, they all add up to zero. What's left is the economists’ notion of capital, the nonfinancial assets: the roads, buildings, machines and so forth.
Very roughly speaking, when there's a net increase in savings, that's where it has to end up - in the nonfinancial assets.
I wanted to get a more tangible sense of what nonfinancial assets look like, of where my savings are going in the physical world. So, back in 2017 I pulled fundamentals data on ~2100 publicly-held US companies. I looked at [...]
---
Outline:
(02:01) Disclaimers
(04:10) Overview (With Numbers!)
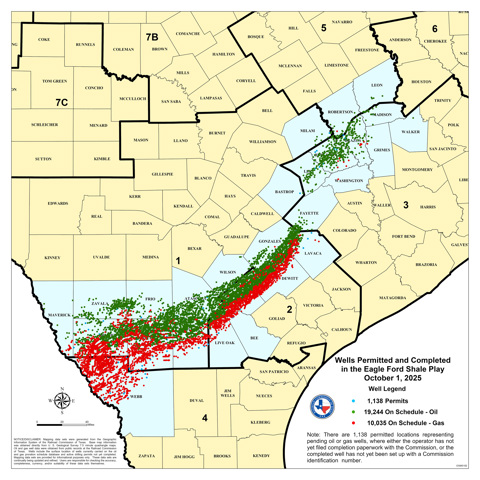
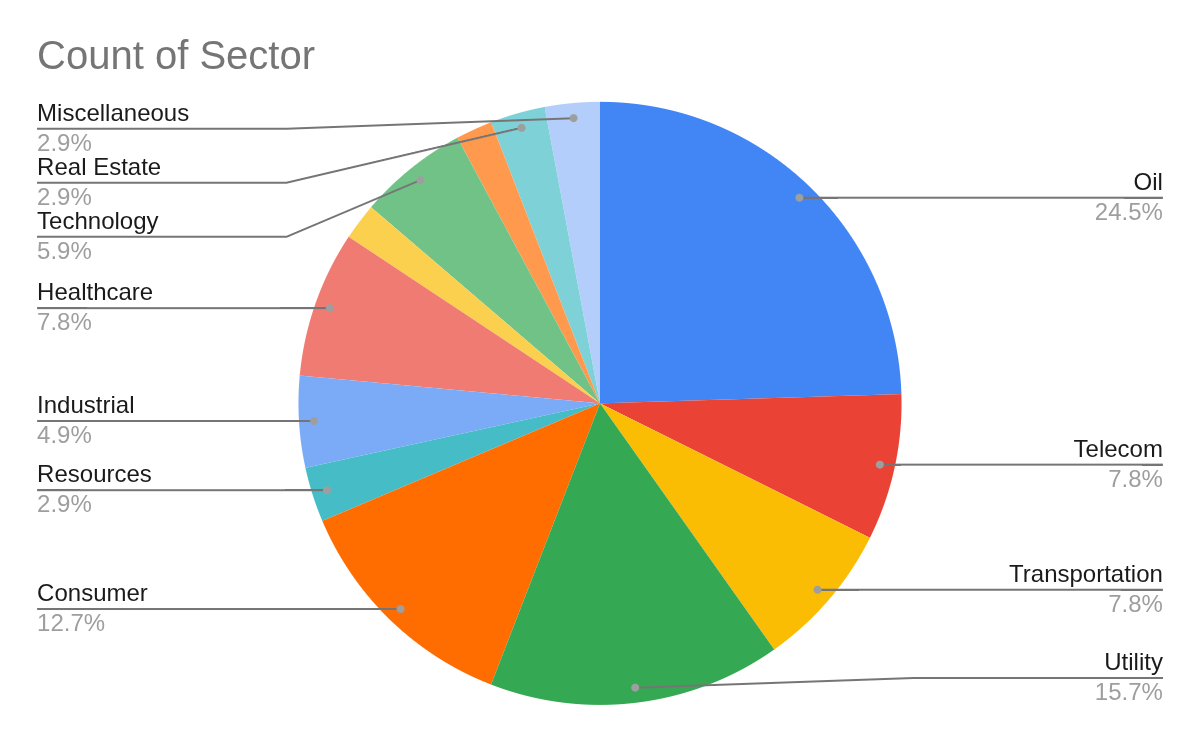
(05:01) Oil - 25%
(06:26) Power Grid - 16%
(07:07) Consumer - 13%
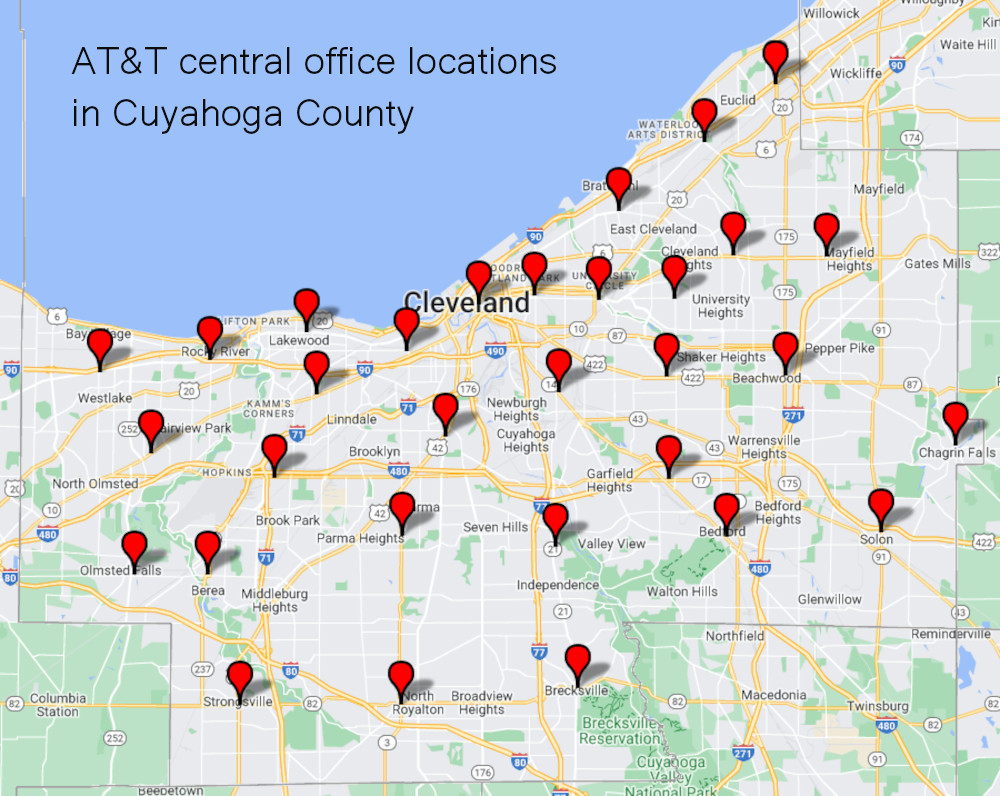
(08:12) Telecoms - 8%
(09:26) Railroads - 8%
(10:47) Healthcare - 8%
(12:03) Tech - 6%
(12:51) Industrial - 5%
(13:49) Mining - 3%
(14:34) Real Estate - 3%
(14:49) Automotive - 2%
(15:32) Logistics - 1%
(16:12) Miscellaneous
(16:55) Learnings
---
First published:
November 16th, 2025
Source:
https://www.lesswrong.com/posts/HpBhpRQCFLX9tx62Z/where-is-the-capital-an-overview
---
Narrated by TYPE III AUDIO.
---
…
continue reading
When economists talk about “capital assets”, they mean things like roads, buildings and machines. When I read through a company's annual reports, lots of their assets are instead things like stocks and bonds, short-term debt, and other “financial” assets - i.e. claims on other people's stuff. In theory, for every financial asset, there's a financial liability somewhere. For every bond asset, there's some payer for whom that bond is a liability. Across the economy, they all add up to zero. What's left is the economists’ notion of capital, the nonfinancial assets: the roads, buildings, machines and so forth.
Very roughly speaking, when there's a net increase in savings, that's where it has to end up - in the nonfinancial assets.
I wanted to get a more tangible sense of what nonfinancial assets look like, of where my savings are going in the physical world. So, back in 2017 I pulled fundamentals data on ~2100 publicly-held US companies. I looked at [...]
---
Outline:
(02:01) Disclaimers
(04:10) Overview (With Numbers!)
(05:01) Oil - 25%
(06:26) Power Grid - 16%
(07:07) Consumer - 13%
(08:12) Telecoms - 8%
(09:26) Railroads - 8%
(10:47) Healthcare - 8%
(12:03) Tech - 6%
(12:51) Industrial - 5%
(13:49) Mining - 3%
(14:34) Real Estate - 3%
(14:49) Automotive - 2%
(15:32) Logistics - 1%
(16:12) Miscellaneous
(16:55) Learnings
---
First published:
November 16th, 2025
Source:
https://www.lesswrong.com/posts/HpBhpRQCFLX9tx62Z/where-is-the-capital-an-overview
---
Narrated by TYPE III AUDIO.
---
676 episodes

))